The Price-to-Value Map
Plot how your price gets set against what it is anchored to, cost or outcome, to see if you are flying blind, cost-disciplined, leaving value on the table, or priced to value.
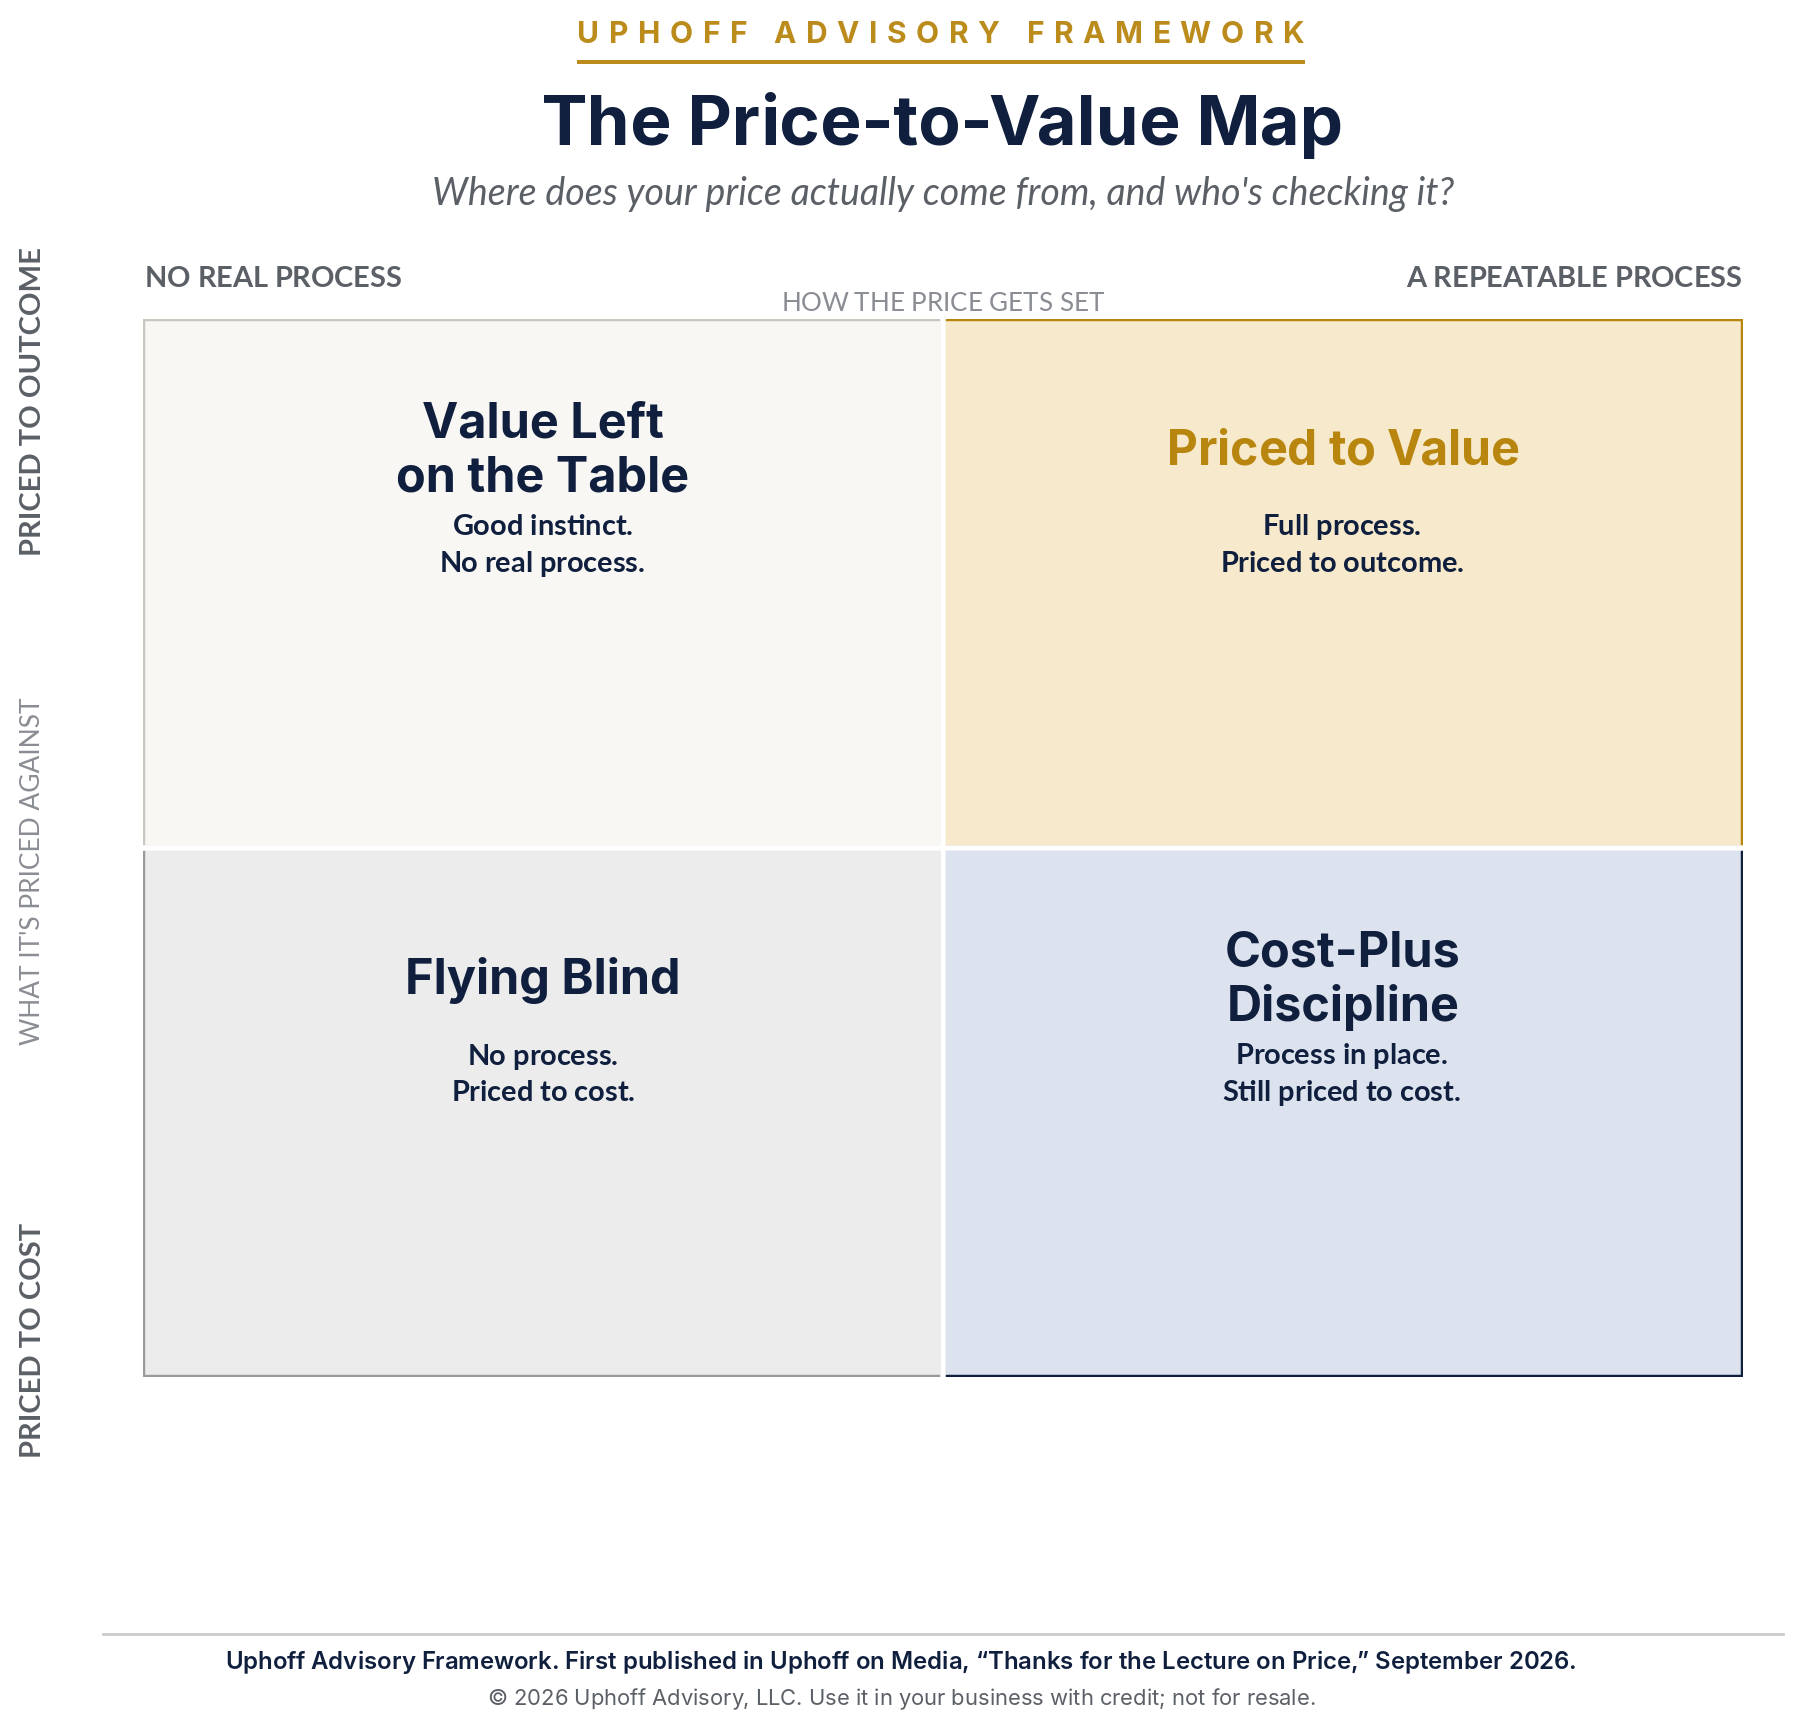
Plot how your price gets set against what it is anchored to, cost or outcome, to see if you are flying blind, cost-disciplined, leaving value on the table, or priced to value.
The Price-to-Value Map is a test of value-based pricing for B2B companies. It plots two things: how a business sets its price, with no real process or a repeatable one, and what you anchor that price to, cost or outcome. As a result, it lands every offer in one of four positions: Flying Blind, Cost-Plus Discipline, Value Left on the Table, or Priced to Value. In short, the map shows whether your price captures the value you deliver.
A real pricing process has three parts. First, market analysis: what the buyer’s alternatives cost. Second, financial analysis: what it costs to win and deliver. Third, positioning: what the outcome is worth to the buyer. Cost-plus shops stop at the financial analysis. However, positioning is where price turns into value, and it is the part most teams skip. That step is what makes value-based pricing work.
How did you set the price: against cost, a competitor’s rate card, or what the outcome is worth? Who owns it: one accountable person, or whoever was loudest the year you set it? How do you check it: monthly against current delivery data, or from memory?
Then plot each one by how you set the price and what you anchor it to.
Flying Blind: first build the process, then move the anchor. Cost-Plus Discipline: add the positioning step. Value Left on the Table: turn the instinct into a process someone owns. Priced to Value: still, recheck it every time your cost to deliver falls.
Finally, track what a unit earns once you count every cost of winning and delivering it.
Good instinct with no real process. Someone senses the outcome is worth more than the invoice says. But because nobody owns charging for it, the price varies deal to deal and leaks into discounting.
AI has cut what it costs to deliver many B2B products and services. As a result, a price anchored to cost falls with it, and the productivity gain goes to the customer instead of you.
Context: a May 2026 survey of more than 230 B2B software and AI companies by Kyle Poyar found investors now prefer outcome-based (26%) and usage-based (24%) pricing over flat-fee (10%) and per-seat (5%).
Related: The Windshield Test · The Revenue per Employee Ladder
The Price-to-Value Map is an Uphoff Advisory Framework created by Tony Uphoff, five-time B2B CEO and founder of Uphoff Advisory, first published in Uphoff on Media on September 30, 2026. Read the full piece: Thanks for the Lecture on Price