The Scale Multiple Map
A 2x2 for services businesses using agentic AI. Plot how much more each person produces against how much revenue per employee has moved, and see whether you're keeping the gain or handing it to clients.
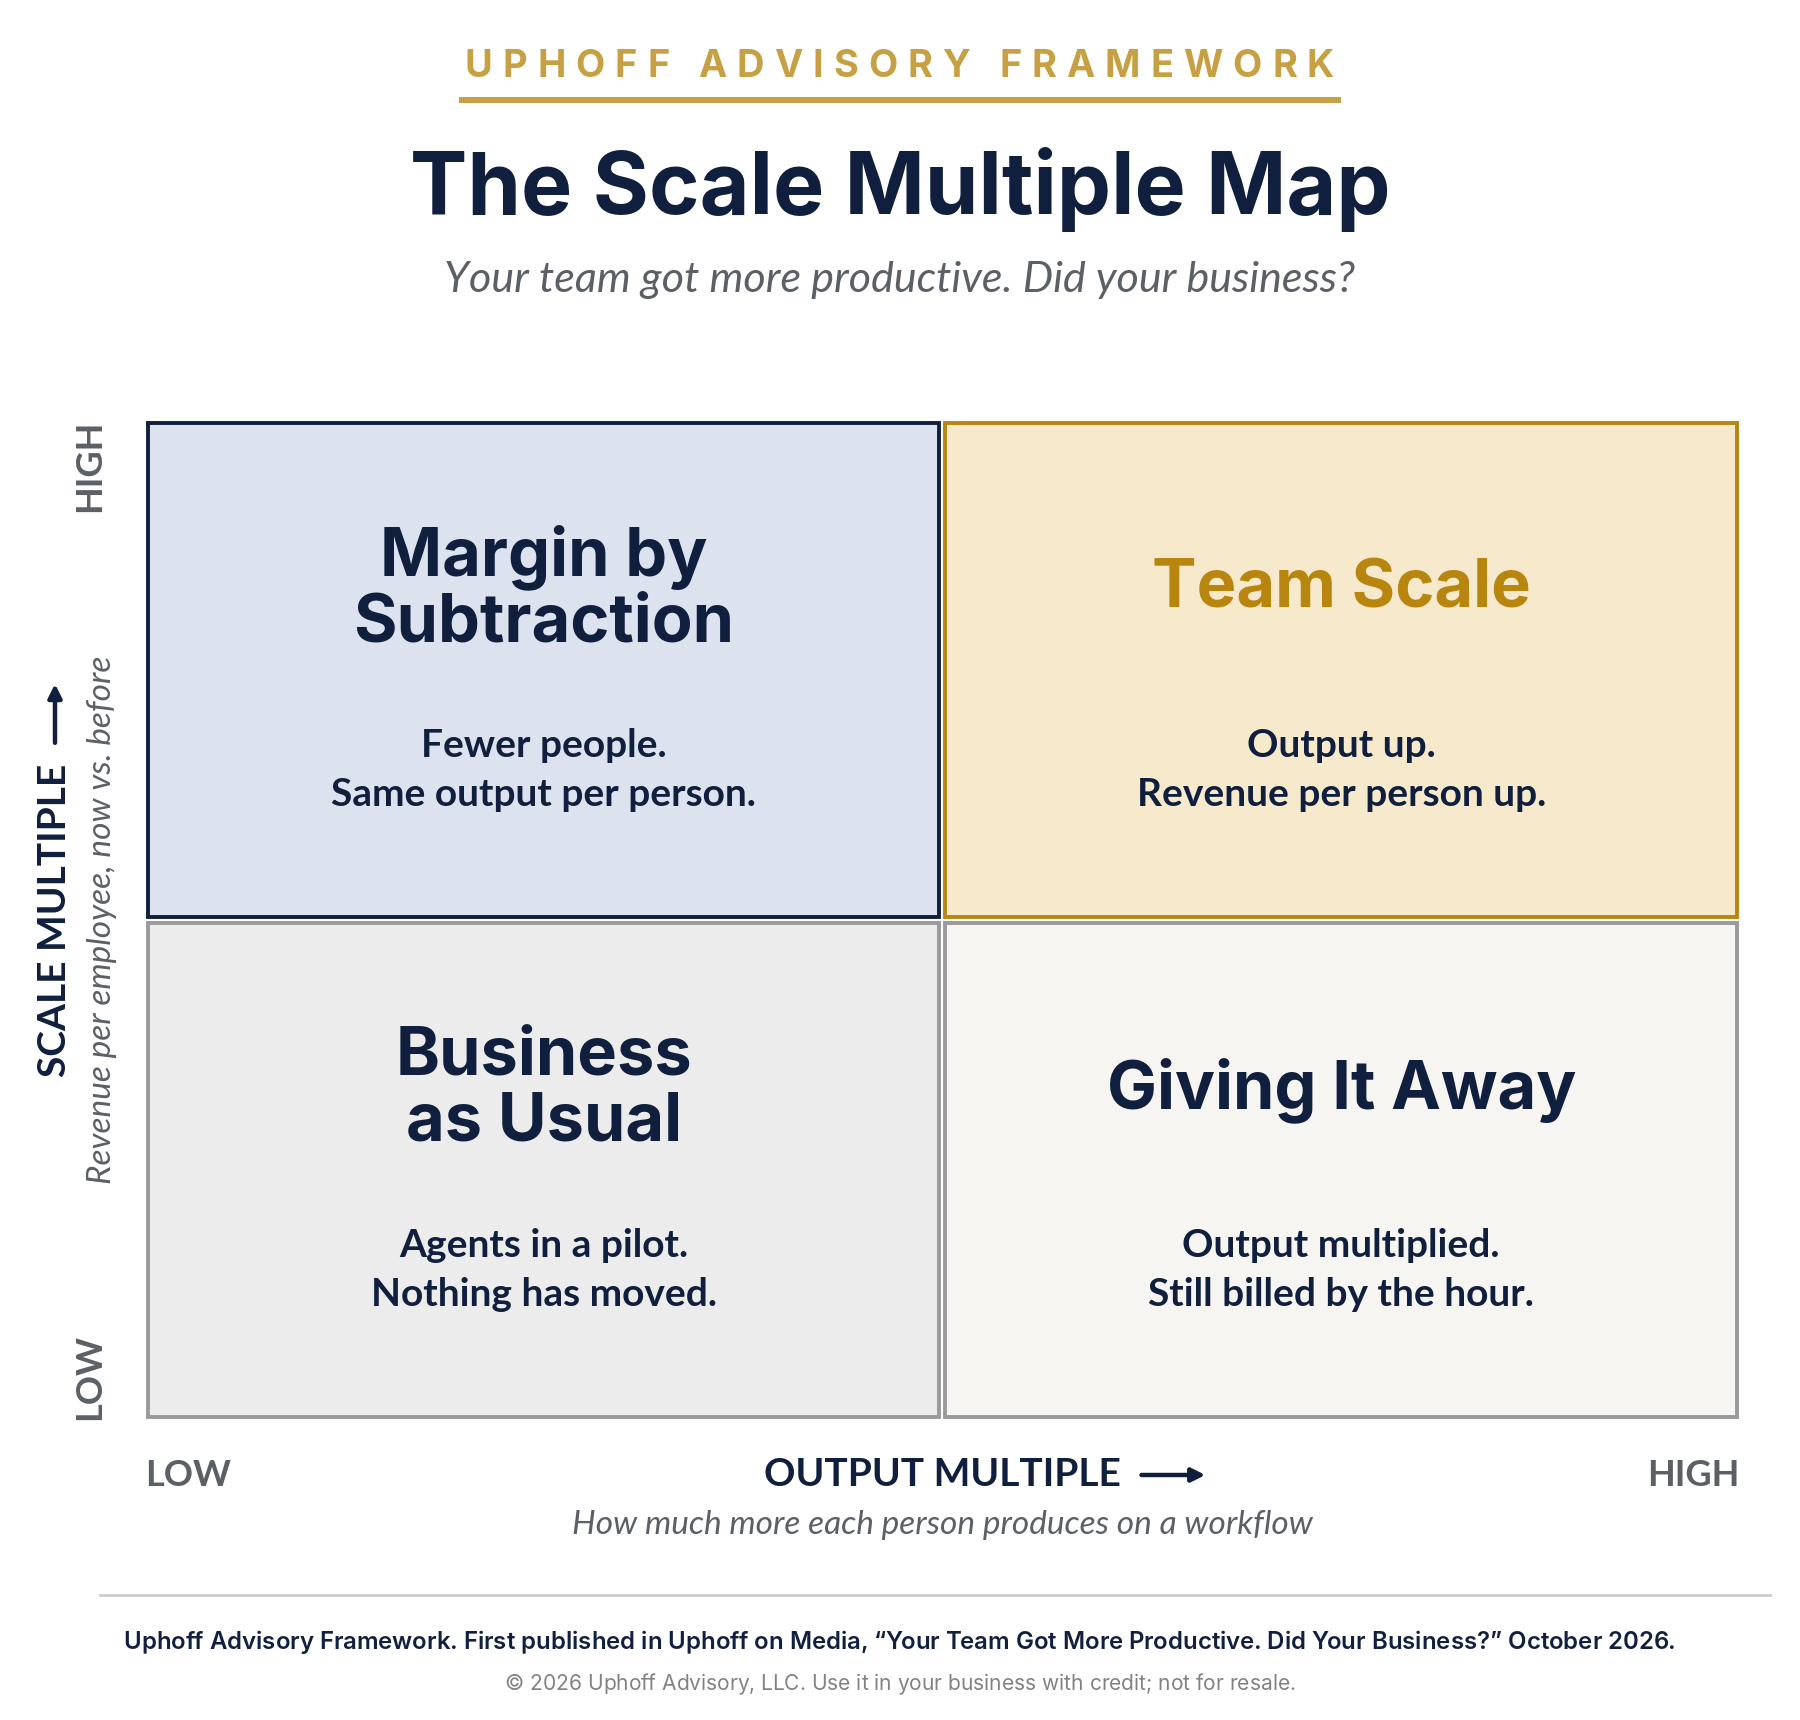
A 2x2 for services businesses using agentic AI. Plot how much more each person produces against how much revenue per employee has moved, and see whether you're keeping the gain or handing it to clients.
Measure two numbers, because only one of them pays. The Output Multiple is how much more a person produces on a workflow now that agents do most of the execution. The Scale Multiple is how much more revenue each person brings in: revenue per employee now, divided by revenue per employee the year before agents. Going from $150,000 a head to $300,000 is a Scale Multiple of 2.
So if the first is high and the second is near one, the productivity gain is going to your clients, not your P&L. The Scale Multiple Map plots the two numbers, shows which of four positions your business is in, and points to what to fix first.
The four squares. Business as Usual: neither number has moved; agents are still a pilot. Giving It Away: output is multiplied and still billed by the hour. Margin by Subtraction: fewer people, same output per person. Team Scale: output up and revenue per person up, with small senior teams and agents doing the execution.
Pick one workflow. Divide output per person per week now by output per person per week before agents.
Divide revenue per employee for the last twelve months by the same figure for the year before agents.
Plot the two numbers on the map.
Move part of the fee from hours to an outcome the client’s CFO already tracks: pipeline created, win rate, payback on acquisition cost.
Cutting headcount raises the ratio but not the multiple a buyer will pay. Growth in revenue per person does.
Track the gap between them. The gap is what you’re handing your clients.
How much more one person produces on a given workflow now that agents do most of the execution.
How much more revenue each person brings in: revenue per employee now, divided by revenue per employee the year before you put agents to work. Going from $150,000 a head to $300,000 is a Scale Multiple of 2. It is the number that shows up in the P&L and, eventually, in the valuation.
Because it raises revenue per employee by shrinking the denominator. Kroll’s Summer 2026 software data shows median margins barely differ by growth rate, while revenue multiples run from 2.4x to 7.2x. In other words, the market pays for growth, not margin by subtraction.
Roughly $400,000 of revenue per employee, well above the 2026 private SaaS median of about $175,000 reported by Benchmarkit.
Related: The Revenue per Employee Ladder · The Price-to-Value Map
The Scale Multiple Map is an Uphoff Advisory Framework created by Tony Uphoff, five-time B2B CEO and founder of Uphoff Advisory, first published in Uphoff on Media on October 26, 2026.